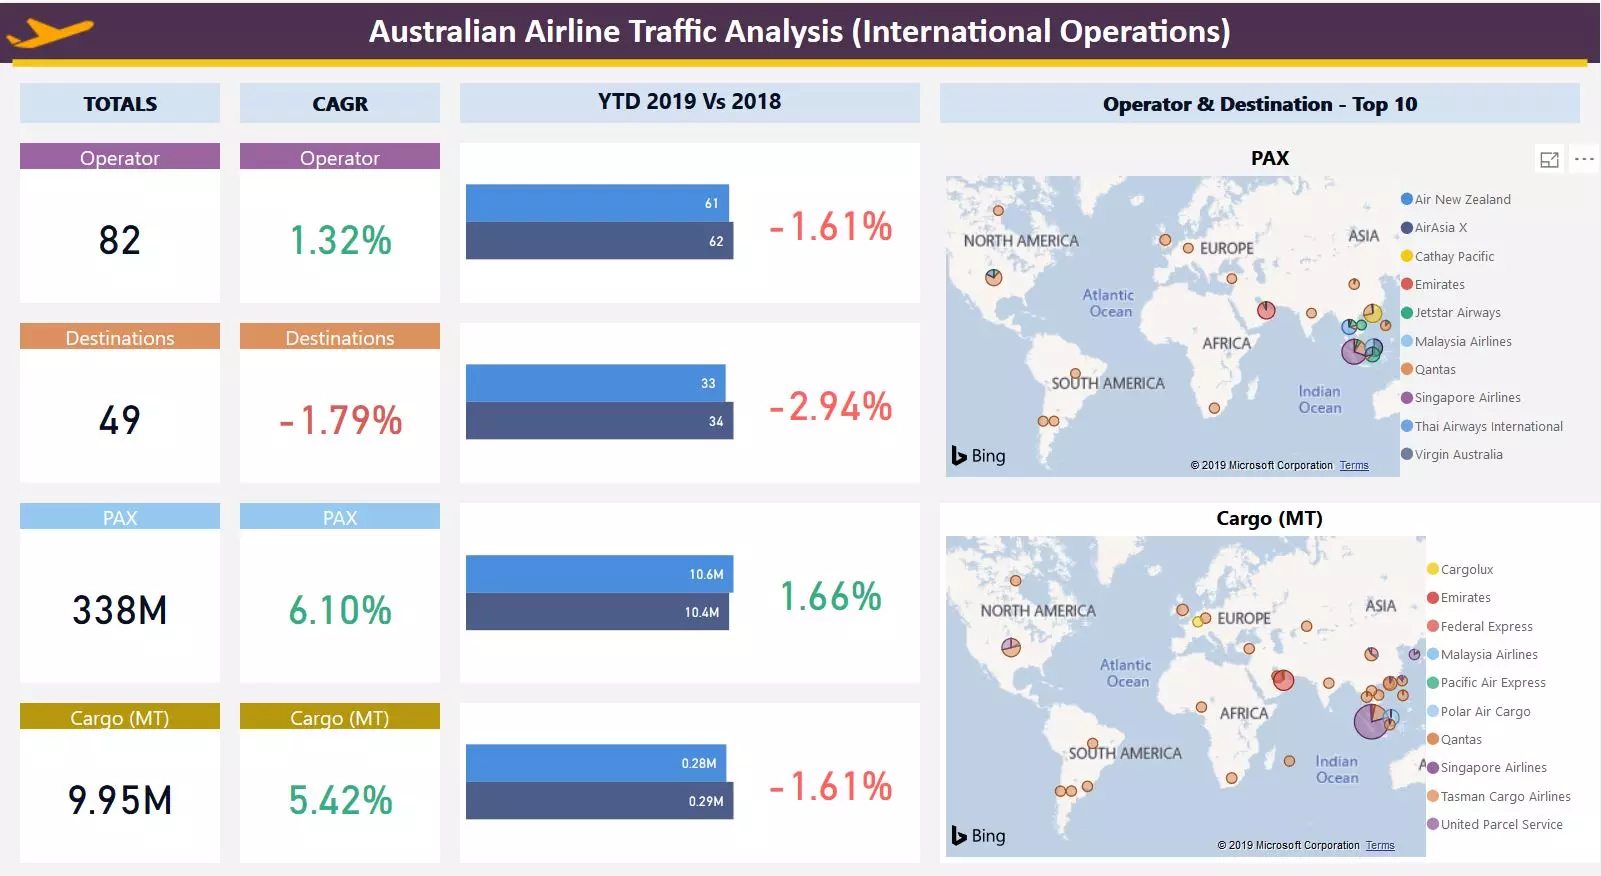


Quick Snapshots at a high level
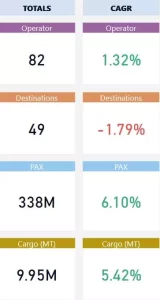
Overall, slow and steady growth in both Passenger and Cargo tonnage.
The number of airline operators is increasing indicating that Operators see a predictable demand in the Australian market. It could be led by tourism or immigration or temporary workers or many other factors.
Interesting to see the number of destinations dropping, which could indicate consolidating into hubs or shutdown of the loss-making routes.
Latest Time context
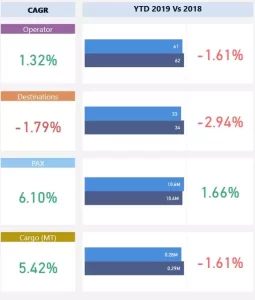
The single quarter comparison shows a drop in all metrics except passenger traffic (Note: YTD in this context is between Jan to March of 2019 & 2018)
The increased passenger traffic is handled by a reduced number of operators and locations.
Existing operators were able to pick up the surge in passengers, thereby should have enjoyed good Load Factors during this period.
Shrink in Operator & Airlines but increase in traffic also implies consolidation in this space. This could also indicate that passengers predominantly choose between a few established operators’ routes with more frequency.
Who handles what?

Between the two types of items a plane can carry i.e. Passenger & Cargo, it is evident that mixed user operators enjoy considerable share in Cargo space.
Within Top-10, four operators in Cargo movement are mixed use (i.e. Qantas, Singapore, Malaysian & Emirates) and remaining are cargo only.
Majority of cargo is shipped along with baggage in scheduled airlines. Only specialized cargo is handled by cargo specific operators. This is another reason for similar plot pattern between Passenger and cargo.
Overall Trend – Where is it heading?

Aggregation causes granularity to change, and highly granular data fail to indicate patterns. For effective time-based analysis, it is advisable to always maintain granularity at Day level.

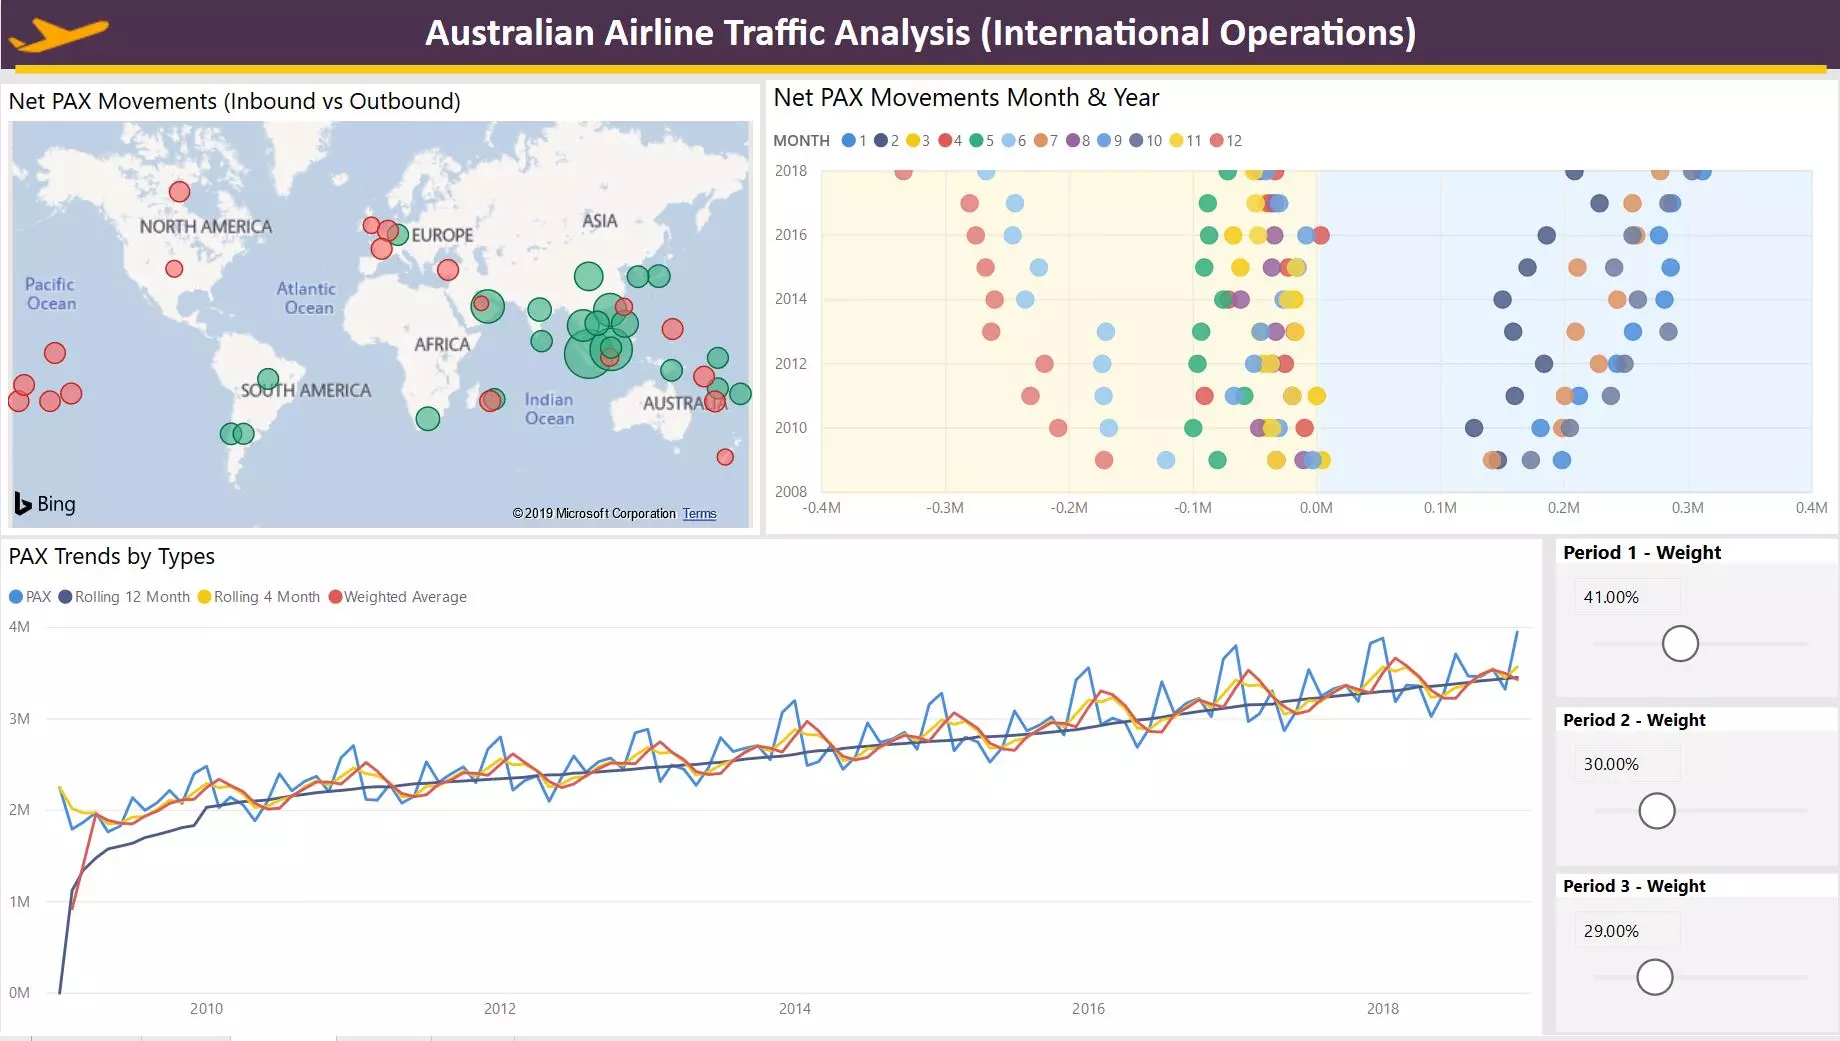
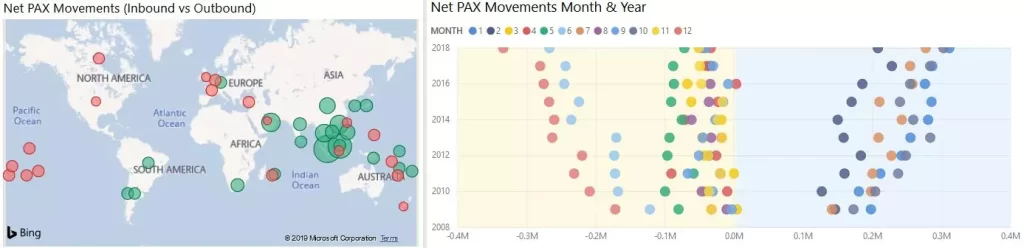
Net passenger movements i.e., the number of passengers entering (Inbound) versus the Number of passengers departing (Outbound) give unique insight from a trend perspective.
Net Movement indicates a strong Inflow consistently across all the years, whereas the rate of growth has slowed down considerably. The overall trend indicates a steady increase in Inbound passenger traffic in the future albeit at a smaller rate.
Consolidated passenger numbers at Quarterly and Monthly levels do indicate an increasing trend but do not indicate any pattern. On the contrary, the Net passenger movement distinctly shows the time periods where Inbound and Outbound traffic fluctuates.
The growth rate appears to be declining from a yearly perspective but shows an increase from a monthly perspective. This is an unwanted side effect of performing time series analysis on aggregated data.
Popular Destination and Popular Times of Airline Traffic Analytics

Data does not represent the final destination of a passenger. Many airlines operate a hub and spoke model and passenger destinations could be different and may not be represented accurately. The base assumption is that the first leg of a passenger journey is alone represented.
Selected Country: United Kingdom
A clear distinction on the countries where that are popular Net passenger traffic.
Origin/Destinations that show a decrease/increase in Net traffic should be viewed as Direct route traffic, which may not
Certain months in a year see huge Net passenger movement versus others supporting seasonality patterns. The biggest difference can be noticed for December (-ve) and January (+ve) coinciding with major holiday season travel.
These fluctuations are consistent across the years and the V shape pattern can be attributed to an increase in Total passenger movement across the years.
For a single country, the overall pattern of passenger traffic influencers apart from the time are many, which could lead to drastically different outcomes during forecasting.
Trend Smoothing
The accuracy of a model is based on the degree of deviation from the actual value. The technique that is able to predict nearest to actual Passenger traffic is the right option for future prediction.
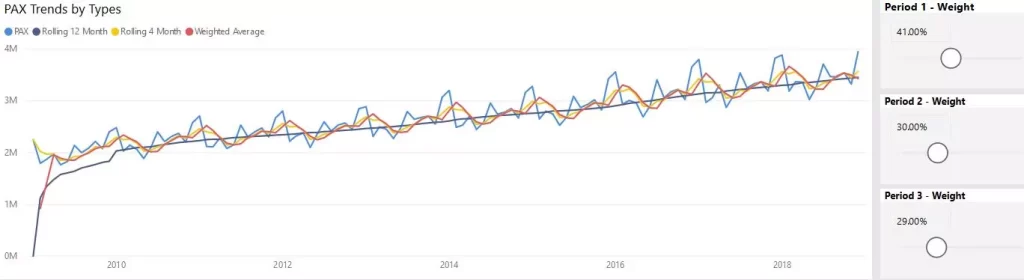
Time series is broken down into two parts (a) Overall trend and (b) Seasonality. Total passengers in the trend indicate both factors at play.
Smoothing time series data is primarily done to forecast future overall trends. Employing a smoothing function ensures that the pattern of actual data is accounted for in the final output.
The rolling 12-month average shows a steady increase in traffic with the increasing trend at the cost of seasonality. Rolling 4-month and Weighted 3-period averages are better methods to analyze trend data as they are able to accommodate both criteria into the final prediction.
Active and Inactive Airlines

The year 2018 is considered a benchmark to compute ‘Active’ and ‘In Active’ status.
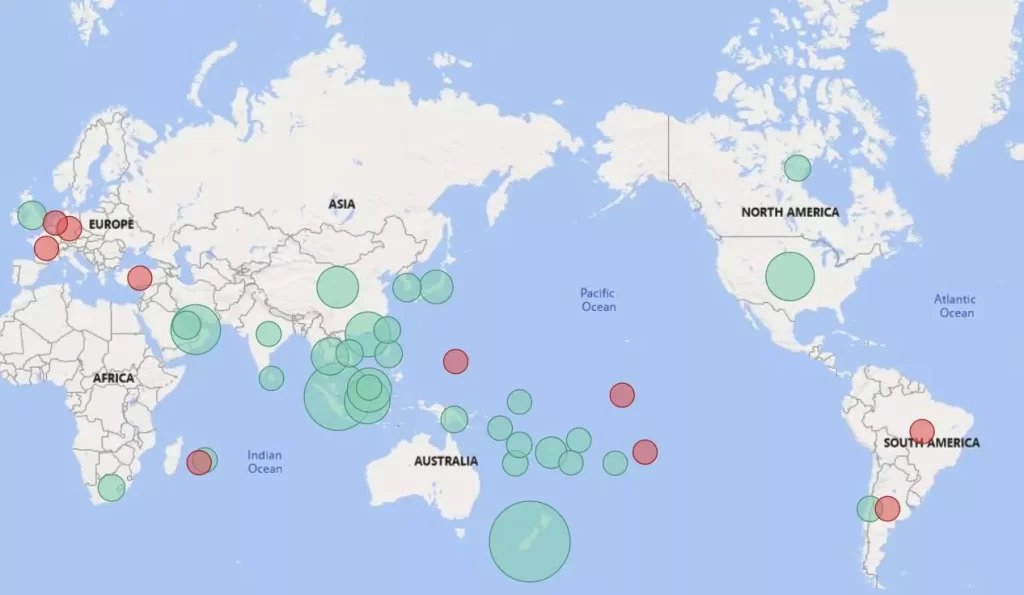
Origin / Destinations to be viewed as ‘Direct Route’ destinations from an analysis perspective.
Among mixed-use operators, Australia-based operators enjoy a significant share in Passengers and Cargo but do not hold a dominant position.
Inactive status indicates countries that are not popular destinations from Operator’s perspective. It can be viewed as the discontinuation of direct routes from Australia.
Passengers may still have final destinations by taking a route with a stopover.
The rationale for discontinuing certain Origin/Destination countries could be lesser load factors for direct routes, passenger volume, and cost of operation.
How they stack up Airline Traffic Analytics KPIs
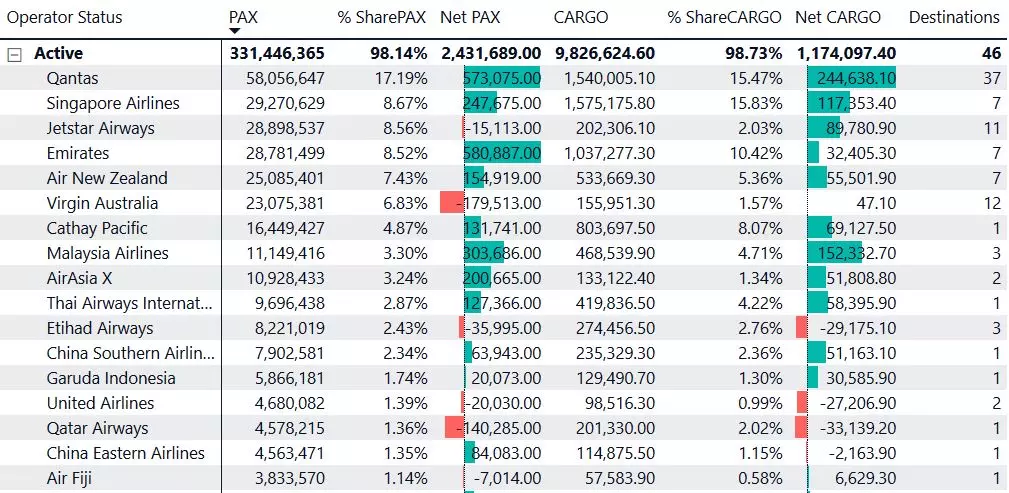

Highlighted data for Qantas
Few operators dominate the segment with a cumulative total of more than 60% market share in both Passenger and Cargo measures.
Australia-based operators have a variety of destinations whereas non-Australian operators focus on a few countries. It clearly indicates that foreign operators prefer a hub and spoke model.
Australia’s leading carrier Qantas is facing good market share across all countries. The airline also had to prune destinations in order to maintain its market position.
The overall trend indicates that the top players and top destinations within the market will continue to do so in the near future.
Other resource:
Air Traffic Analytics of International Operators– Case study